The price of the safest walk
We routed all 9,731 homes in our 14 walk zones twice, shortest and safest, then sampled all 188 FCPS attendance zones. The safest walk typically takes 25 seconds longer, and it cuts walking in the roadway of busy roads by 86%.
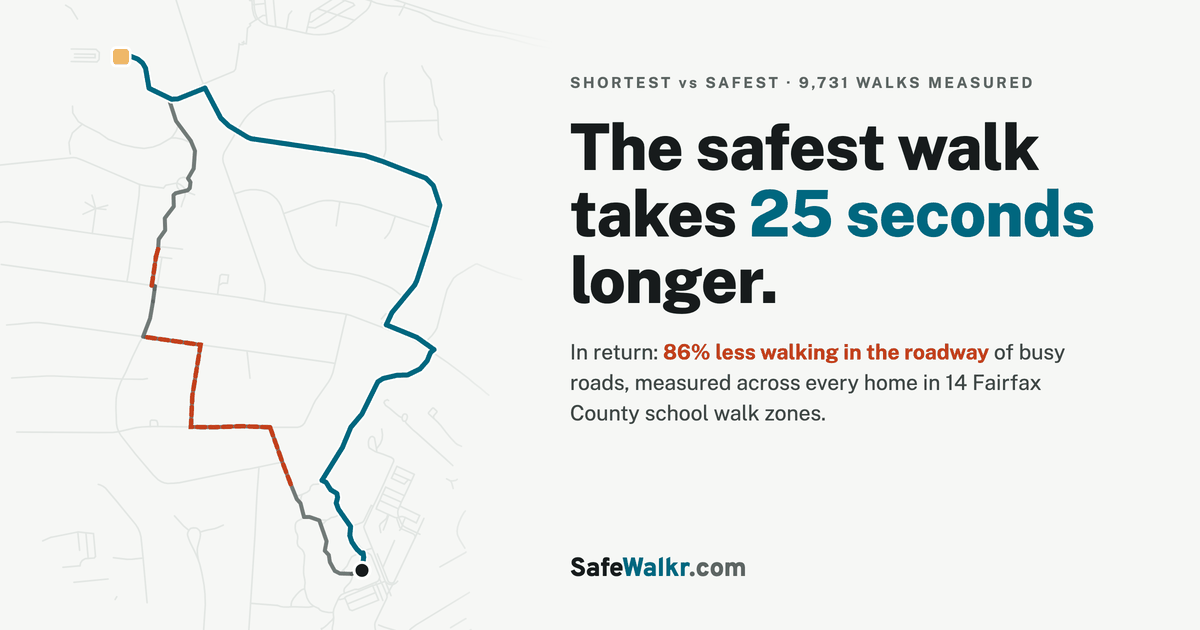
Every mapping app answers the same question: how do I get there fastest? For a nine-year-old on foot, that is the wrong question. The right question is what the fastest route gives up. Nobody had measured that for Fairfax County. So we measured it.
We routed every one of the 9,731 homes in SafeWalkr's 14 walk zones twice. Once the way SafeWalkr routes: prefer sidewalks, avoid traffic, minimise crossings, use guards. And once the way a distance-first app would route: same streets, same walking map, every safety preference off. Then we did the same for a 2,571-home sample across all 188 FCPS attendance zones. This post is what came back.
The short version: for two of every three homes, the safest walk is not the shortest walk, and for a typical home it takes only 25 seconds longer.
One home, two walks
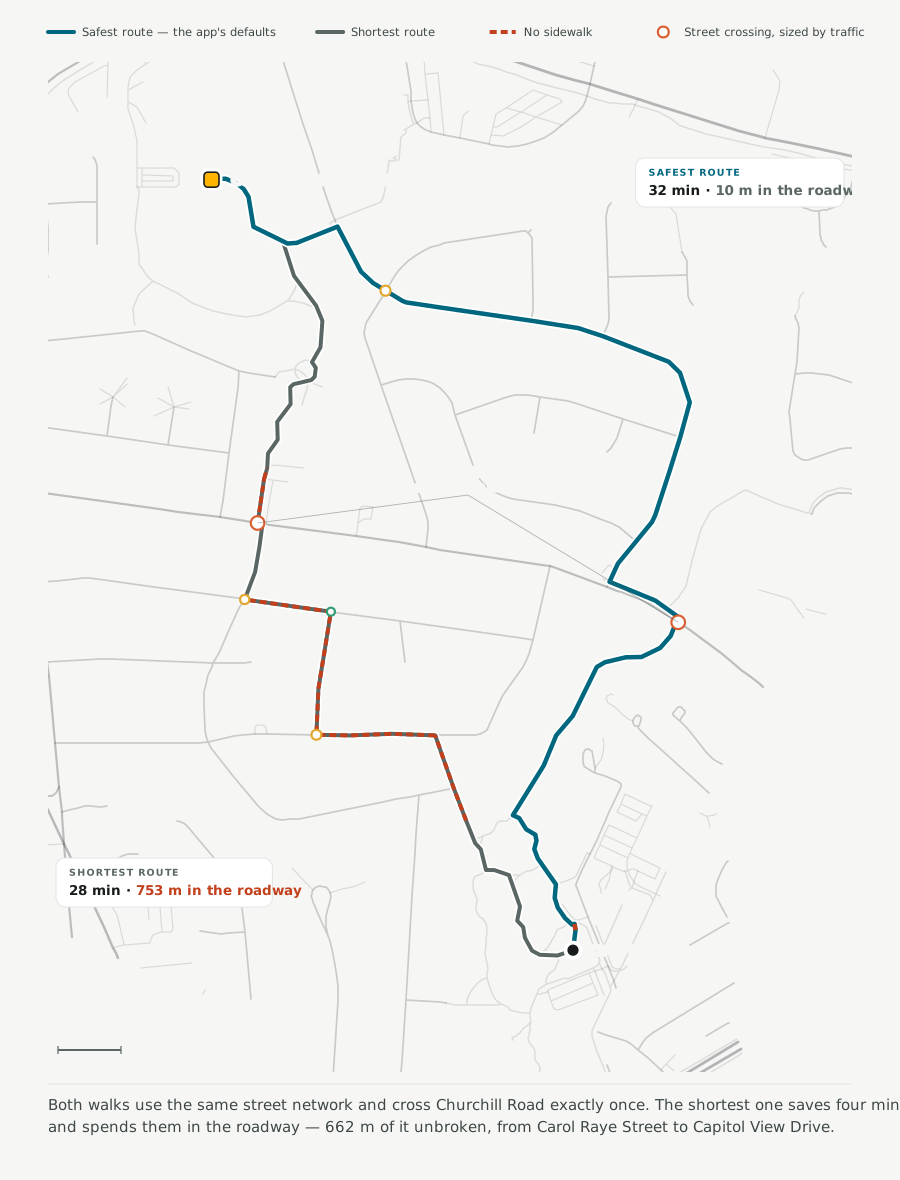
From 1244 Oak Ridge Avenue to Cooper Middle School, the shortest route takes 28 minutes at a child's pace. The safest takes 32. Here is what each route does with the time:
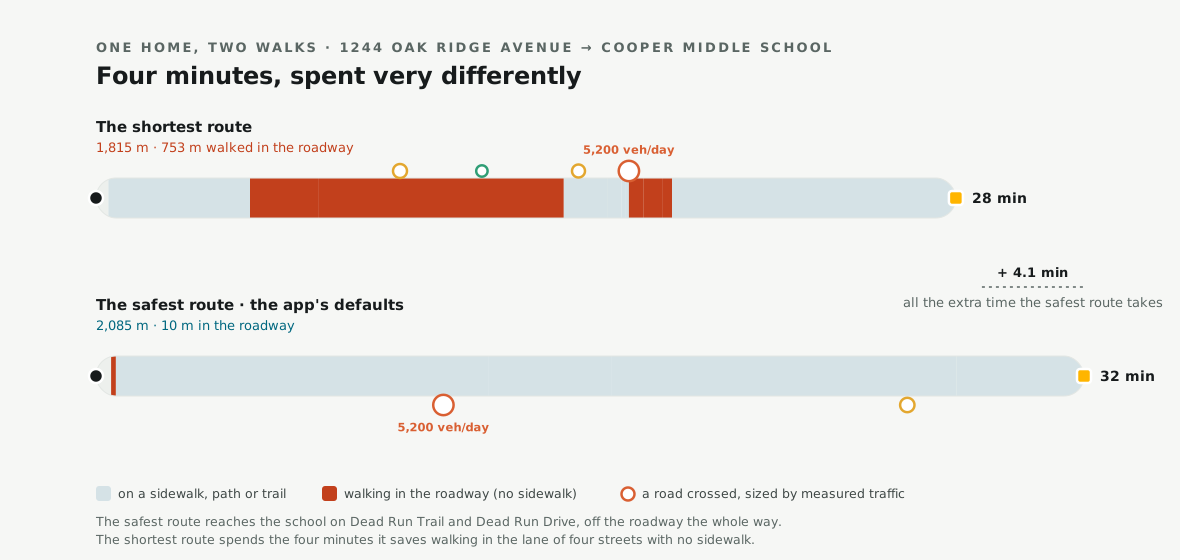
The shortest route saves four minutes, and it spends them walking 753 metres in the roadway: the full length of Carol Raye Street, Elizabeth Drive and Theresa Ann Street, and most of Capitol View Drive. None of those streets has a sidewalk on either side. This is what those four minutes look like at eye level:
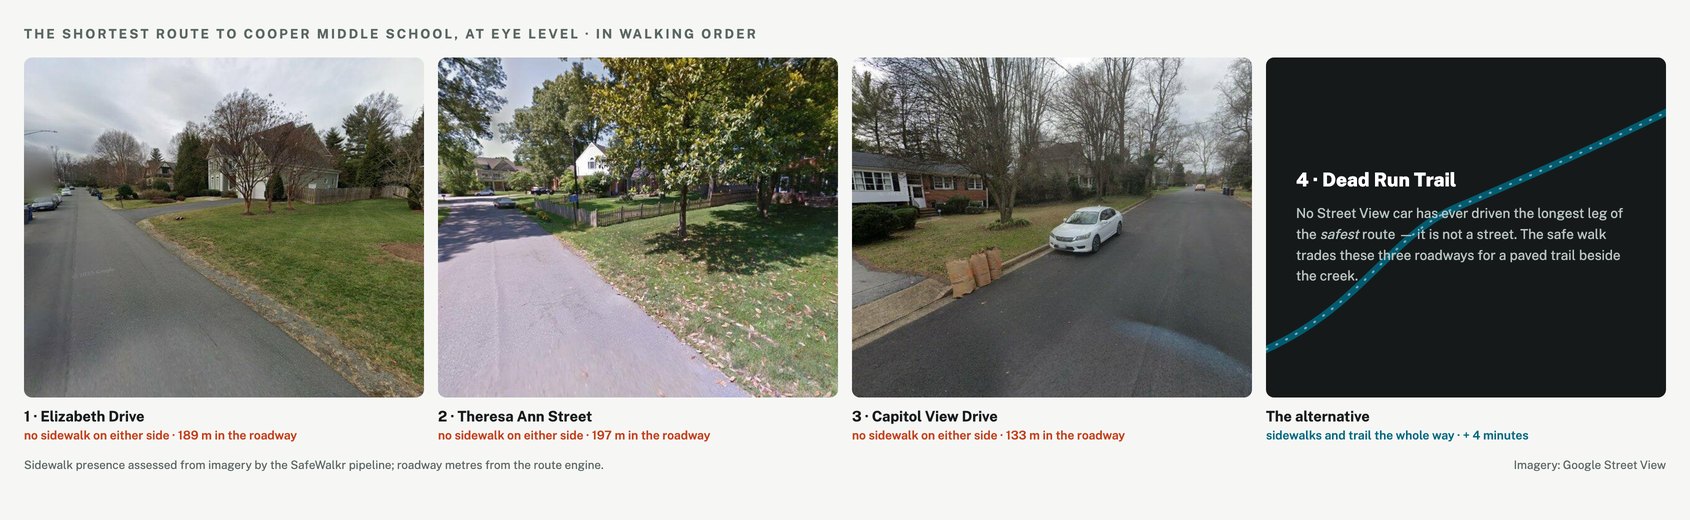
The safest route solves the same walk by leaving the street grid. Its longest leg is Dead Run Trail, a paved path that most routing apps ignore because it is not a street. The safest route walks ten metres in the roadway, total. It crosses two roads instead of four, each stepped across once. One of them carries 5,200 vehicles a day, and the route accepts that crossing because every alternative was worse.
The price, and what it buys
Now scale that trade to the whole district. For 35% of the 9,731 homes, the two routes are identical: the same streets, step for step. Those walks are already as safe as the street network can make them, mostly on the quiet looped streets that FCPS drew its zones around. For the other 6,291 homes, the safest route is a different route, and the trade works out like this:
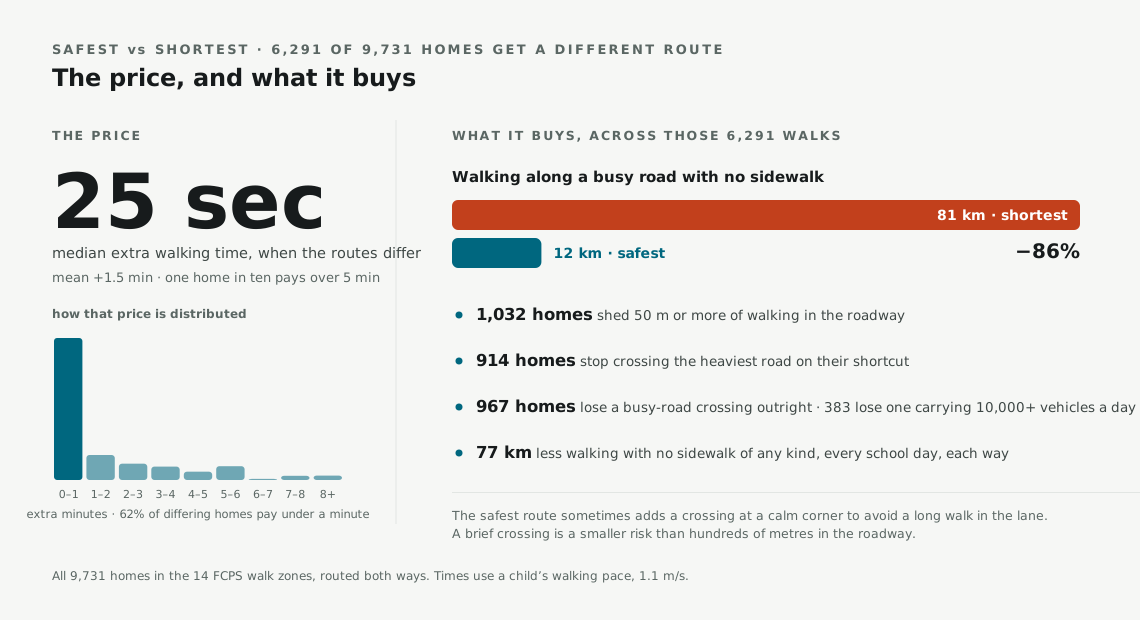
The headline number is the red bar. Summed over those 6,291 walks, the shortest routes spend 81 km walking along busy roads with no sidewalk. That is a child in the lane of a road carrying 2,000-plus vehicles a day. The safest routes spend 12 km: an 86% cut. The typical home pays 25 extra seconds for it, and 62% of the homes that pay anything at all pay under a minute.
One number cuts the other way. District-wide, the safest routes make 348 more busy-road crossings than the shortest ones. That is a deliberate trade, not a mistake. A step across a busy road at a calm corner is one brief, bounded risk. Four hundred metres walking in the lane of that same road is not. So where the two conflict, the safest route accepts the crossing and refuses the roadway. The Justice HS zone shows the same trade at its most expensive. The safest route there typically adds 4 minutes, the most in the district, and what it buys is escape from 46 km of roadway walking that the zone's shortest routes would otherwise take.
The whole county, sampled
The 14 walk zones are where we can measure every home. To check that the pattern holds beyond them, we sampled 14 homes at walking distance in each of the 188 FCPS attendance zones (inside FCPS's own eligibility distances: one mile for elementary, one and a half for middle and high) and routed all 2,571 of them both ways.
The pattern holds, and it gets stronger:
- 79% of sampled homes county-wide get a different safest route. The typical extra time is 66 seconds.
- Walking along busy roads with no sidewalk falls 74% on the safest routes.
- The effect grows with the student: 74% of elementary walks differ, 91% of middle, 93% of high school walks. The typical extra time rises with it, from 47 seconds to about two minutes. The longer the walk, the more the shortest route gives up.
Elementary zones are drawn tight, around exactly the quiet streets where short and safe agree. Middle and high schoolers walk farther, along and across the busier roads where the two answers split. They are also the students most likely to be handed a phone with a generic maps app on it.
Where the routes agree
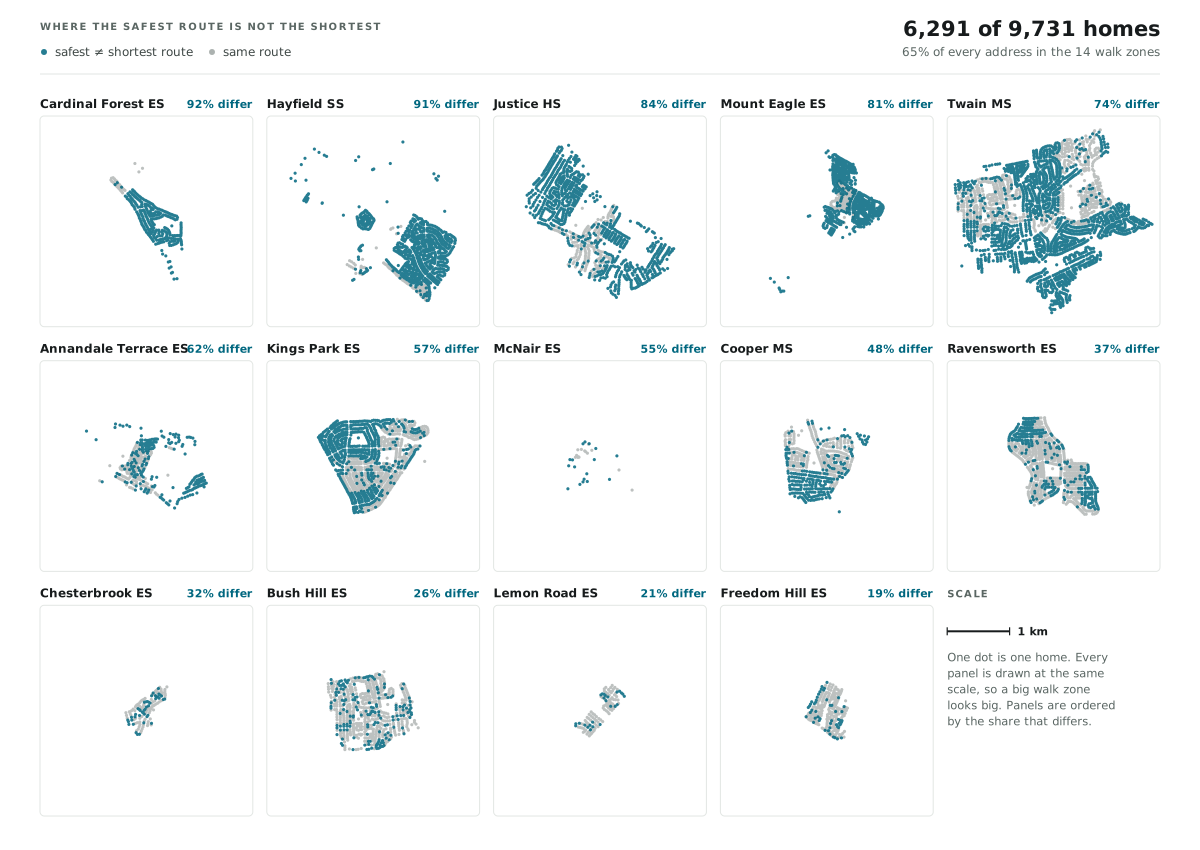
The grey dots say as much as the teal ones. In the Freedom Hill ES zone, 81% of homes get the identical route both ways: the neighbourhood's sidewalks are complete enough that the shortest walk already is the safest. In Cardinal Forest ES, 92% of homes get a different route. Same county, same school system. The difference is street pattern and sidewalk coverage, block by block. A single district-wide policy cannot see that difference. A route built on the county's own sidewalk inventory and traffic counts, block by block, can.
What we take from this
The street data Fairfax County publishes is good enough to do this. The sidewalk inventory, the 2024 traffic counts, FCPS's crossing-guard postings: everything in this post is computed from public county and FCPS data, over OpenStreetMap's map of streets and paths. Few counties in the country could support this analysis. Fairfax can, and that is to its credit.
The safest walk is cheap almost everywhere. For most homes, the safer walk costs seconds. And the biggest single hazard, walking in the roadway of a busy road, nearly disappears through route choice alone, before a single metre of new sidewalk is poured. Where the detour is expensive, as with Justice's four minutes, the same data doubles as a map of exactly which sidewalk segments would make it cheap.
No generic app will find these routes. A route can only avoid a missing sidewalk if it knows the sidewalk is missing. SafeWalkr joins the county's sidewalk inventory, its traffic counts and FCPS's guard posts onto the walking map, and weighs what a child's walk actually costs. That is the entire product. Open the map, put in your address, and look at what the route does. Then walk it once with your child before trusting it to them.
Methodology
- What was routed. Every home in the 14 walk zones: 9,731 addresses, each routed twice. The safest run uses the app's defaults (prefer sidewalks, avoid traffic, minimise crossings, use guards). The shortest run turns every safety preference off. Both runs use the same walking map, so any difference between the two routes comes only from the safety preferences.
- County sample. 14 homes per attendance zone, drawn repeatably at random from addresses inside FCPS's walking-eligibility distances (1.0 mile elementary, 1.5 miles middle and high): 188 zones, 2,571 homes routed. Two zones (Irving MS and Mount Vernon HS) could not be routed from their sampled homes because of a data gap at the school connection, which we have logged.
- "In the roadway" means metres walked on a street with no sidewalk. "Along a busy road" also requires that street to carry a measured 2,000+ vehicles per day in the 2024 county counts, or to be a road type that implies it. Times use the app's child walking pace, 1.1 metres per second.
- "Identical" means the two routes follow exactly the same streets, step for step, not merely that they are equally long.
Numbers in this post describe the model's route choices over public data, not field-verified conditions. A route is guidance to plan a walk, not a safety guarantee. No route replaces an adult walking it first.
Questions, corrections, or a walk you want measured: info@safewalkr.com.