Walking to school, by the numbers
We routed all 9,731 homes in SafeWalkr's 14 walk zones and measured the walks. Sidewalk coverage, busy-road crossings, the longest gaps, and where the safest route still walks in the roadway.
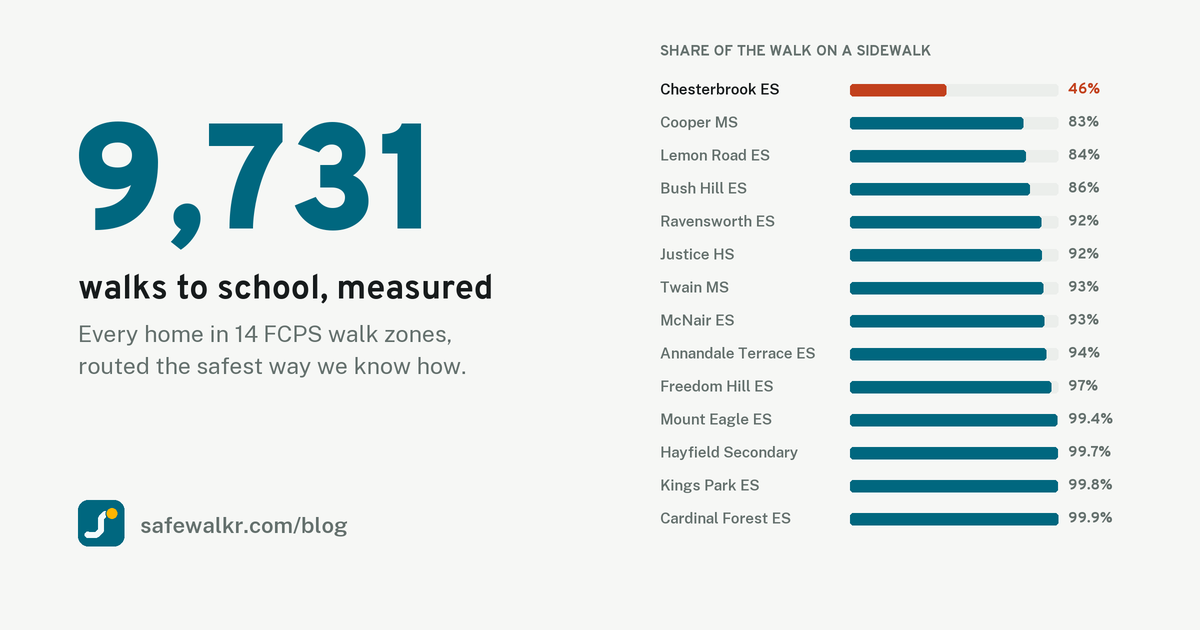
A walk zone is a promise: live here, and your child can walk to school. We wanted to see what that promise looks like street by street. So we routed every one of the 9,731 homes in SafeWalkr's 14 walk zones to its school, each on the safest route the app can find with its default settings, and measured the results: 9,614 km of walking in total.
A generic mapping app cannot produce these numbers, because it does not know which streets have sidewalks or how much traffic they carry. SafeWalkr knows both, for every stretch of every walk. Five findings stood out.
1. A walk zone can fail in two opposite ways
Across the district, 93.5% of all safest-route walking distance is on a sidewalk. But that average hides a wide spread, and the two worst zones fail in opposite directions.
| Zone | Sidewalk share | Homes crossing a busy road |
|---|---|---|
| Chesterbrook ES | 46.1% | 0% |
| Cooper MS | 83.2% | 28% |
| Lemon Road ES | 84.4% | 2% |
| Bush Hill ES | 86.3% | 0% |
| Ravensworth ES | 91.9% | 1% |
| Justice HS | 92.1% | 19% |
| Twain MS | 92.7% | 49% |
| McNair ES | 93.3% | 7% |
| Annandale Terrace ES | 94.2% | 15% |
| Freedom Hill ES | 96.7% | 2% |
| Mount Eagle ES | 99.4% | 52% |
| Hayfield Secondary | 99.7% | 90% |
| Kings Park ES | 99.8% | 16% |
| Cardinal Forest ES | 99.9% | 3% |
Chesterbrook has the worst sidewalk coverage in the district. Less than half the walk is on a sidewalk, and 3 in 4 homes walk more than 50 m in the road. Yet it has zero busy crossings: no measured road in the zone tops 1,000 vehicles a day. Hayfield is the mirror image. It is almost fully sidewalked, yet 90% of its homes must cross a busy road, and 81% cross one carrying 10,000+ vehicles a day. A single "walkability score" would rate both zones as fine. They are not. Each is dangerous in its own way.
2. One home in three must cross a busy road
Of the 9,731 homes, 32% cannot reach school without crossing at least one busy road (2,000 or more vehicles a day), and 21% must cross a road carrying 10,000 or more vehicles a day. The heaviest road any walk in the district crosses carries 30,000 vehicles a day.
These are the crossings left on the safest route. The route has already gone out of its way to avoid every crossing it could.
3. The longest gap is two-thirds of a mile of walking in the road
Most homes have no sidewalk gap at all: for the typical home, the safest route never leaves the sidewalk. The extremes are what matter. Six zones have a home whose route includes a continuous gap of over 600 m, and the worst single walk in the district spends 985 m, nearly two-thirds of a mile, on Valley Lane in the Justice HS zone without a sidewalk.
For typical experience the standout is again Chesterbrook: the median home there walks a 126 m continuous gap, and 42% of homes have a gap over 200 m.
One caveat. These gaps sit on the safest route SafeWalkr found, and the safest route sometimes accepts a gap in trade for fewer crossings or less traffic. For about 43% of the homes with a gap, no route does better. For the rest, a route with more crossings or more traffic could avoid the gap. Either way, this is the walk SafeWalkr would hand a parent.
4. Where the safest route walks in the roadway of a busy road
The worst combination is walking along a busy road with no sidewalk: a child in the roadway, sharing the lane with 2,000+ vehicles a day. 173 homes (1.8% of the district) have a route that does this for more than 25 m. In the Freedom Hill ES zone it is about one home in ten, though the stretches there are short. The single worst case is in the Justice HS zone: one continuous 307 m stretch in the roadway of a busy road.
5. Safety costs 60% more walking, and guards rarely help along the way
The safe route is not the short route. Across the district, the safest route averages 1.60× the straight-line distance (the median walk is 921 m for a 618 m straight-line trip). Freedom Hill ES pays the most: 1.79× on average, and one home in twenty walks more than three times its straight-line distance.
Crossing guards should soften finding 2, but mostly they do not. 45% of routes pass an active guard post, yet only 8.2% pass one more than 150 m from the school's own front door. The rest pass only the post at the school entrance, which every walk reaches anyway. Of the 3,106 homes that must cross a busy road, just 5.6% get a guarded crossing along the way. Guarded mid-route crossings exist in only 4 of the 14 zones.
The missing sidewalk that would help the most
Add up the no-sidewalk metres on each street, across every home's route, and you get a ranked to-do list. At the top: Larpin Lane in the Twain MS zone. 392 homes each walk about 116 m of it with no sidewalk. Together, that is 45.6 km of children walking in the roadway per school day, each way. Chesterbrook's Macarthur Drive (92 homes × 304 m) and Justice's Valley Lane (53 homes × 371 m) follow. One sidewalk on any of these streets improves hundreds of walks at once. This is exactly the map of gaps we want the county to see.
Methodology
- What was measured. Every home in the 14 walk zones: 9,731 starting addresses, each routed to its school with the app's defaults (prefer sidewalks, avoid traffic, minimise crossings, use guards). Every home routed successfully. Homes inside two overlapping zones are counted once per zone.
- Sidewalk shares cover the walked streets. The short connections at each front door are excluded. A stretch counts as sidewalked when the county walkway inventory or OpenStreetMap records a sidewalk there. Stretches with unknown status are vanishingly rare and are never counted as gaps.
- Gaps are unbroken stretches of route with no sidewalk, measured in walking order. Parking aisles and driveways on school property are excluded from the street rankings.
- Busy means a measured 2024 average daily traffic count of 2,000+ vehicles per day, or a road type that implies it. We count only the crossings the data is certain of, and 94% of them carry a numeric county count.
The obvious next question: how much of this does the county's sidewalk record get wrong on the ground? That is what the Street View imagery check exists to answer. That comparison is the next post.
Questions, corrections, or a street we should look at first: info@safewalkr.com.